Collecting water quality data from eutrophic Rotokawau / Virginia lake, New Zealand
 |
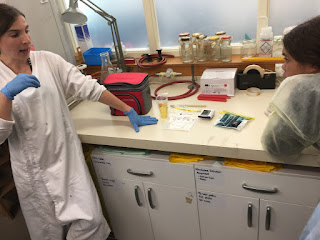
| First collect your water sample |
 |
| Google maps |

At the lakeside:
- Water temperature. The temperature of the water affects how much oxygen it can hold
- pH. The pH tells us how acidic (pH below 7) or alkaline (pH above 7) the water sample is. This in turn can affect processes that occur in the lake. For example, at low pH values, nutrients trapped in lake sediments can redissolve and be taken up by living organisms including algae. At high pH values harmful levels of ammonia gas can be released during decomposition of rotting organic matter.
- Dissolved Oxygen. Oxygen is essential for living things. A higher amount of oxygen in the water than is possible from oxygen dissolved solely from the air above (supersaturation) is due to aquatic plant photosynthesis. Lower amounts of oxygen indicate higher water temperatures or higher microbial activity.
- Turbidity. The cloudiness / clarity of the water can affect aquatic animals that hunt by sight and macrophyte (large plant) photosynthesis, for example.
- Conductivity. This gives an indication of the amount of dissolved substances in the water sample.

Back in the laboratory:
- Nitrate ion. As organic matter in the lake decomposes nitrogen is recycled as nitrate.
- Ammonium ion. For any given pH value, ammonium ions are in equilibrium with ammonia which is formed when organic material decomposes
- Phosphate ion. The amount of soluble phosphate ion in water is often the limiting factor in the growth of microorganisms, plants and algae. Some toxic algae are able to store phosphorus and fix their own nitrogen in order to out compete other types of algae. The phosphate test is performed using a simple swimming pool test kit (Natural Chemistry Phos-Test) which is recommended by the UK Department of Environment for use in water sampling when no other methods are available.
- Total coliforms / E. coli. Coliform bacteria are present in faecal matter and in the environment but only the sub group e.coli are used to indicate the definite presence of faecal matter (poo!) in freshwater and hence the potential for infection. In swimming areas (and swimming is not encouraged at the lake if it is not part of an organised sporting event) the 'safe' limit for e.coli is less than 260 units per 100mL of water. On the inoculated growth pad shown, e.coli are indicated by dark blue / purple units whereas coliforms appear as turquoise coloured units. The microbes are grown from a 1.000ml sample taken from a sterile bottle.
- Biological Oxygen Demand. This measures the amount of oxygen used up by microbes in a water sample over a five day period after the sample is stored in the dark.

 |
| Cyanobacteria as they appear under the microscope (captured by phone camera) |
As a footnote to the measuring that is being carried out, it has to be said that we are not equipped to measure the amount of algae in the water. Cyanobacteria or blue-green algae can be toxic and are particularly dangerous. However, we will see soon enough through our own eyes or read about it in the newspaper when the next algal bloom appears in Rotokawau / Virginia lake. It would be nice to think that we could look back through the data we are collecting to see if it gives us any clues as to what triggers these events. That, in theory, is what we are trying to do.


Comments
Post a Comment